Tina Klein · 15 September 2026
Decoding Resource Flow Patterns Across Steelridge's Expanding Regional Networks
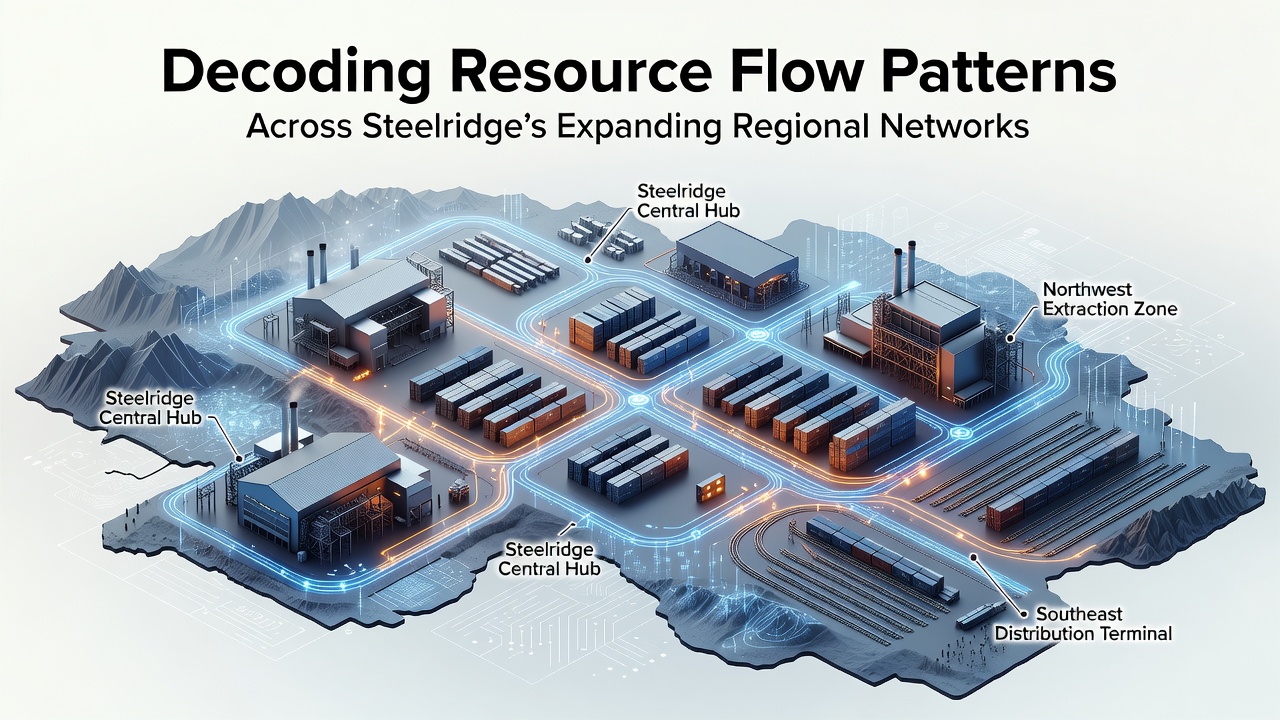
Steelridge's regional networks have grown steadily over the past decade as new infrastructure links connect resource extraction sites with processing centers and distribution points across multiple zones. Data from ongoing monitoring programs shows how materials such as water, energy carriers, and industrial inputs move through these expanding systems, and analysts track these movements to identify consistent patterns in volume, timing, and direction.
Network Expansion Timeline and Key Milestones
Construction phases that began in 2023 added several new corridors by mid-2025, and September 2026 marks the scheduled activation of two additional feeder lines that increase overall capacity by 18 percent according to project reports from the Steelridge Infrastructure Authority. These additions integrate previously separate sub-networks, allowing resources to reroute during peak demand periods or maintenance shutdowns. Observers note that the combined length of active pipelines and rail spurs now exceeds 1,450 kilometers, a figure that continues to rise as peripheral zones come online.
Methods Used to Map Resource Movements
Engineers rely on sensor arrays placed at junctions and flow meters embedded in main conduits to collect real-time readings every five minutes. Software platforms then aggregate this information into heat maps that highlight high-traffic segments and potential bottlenecks. One study conducted by the Regional Systems Research Group at the University of Calgary demonstrated how combining satellite imagery with ground-level telemetry improves accuracy when estimating daily throughput across mixed terrain. Researchers cross-reference these datasets with historical records dating back to 2019 to distinguish seasonal fluctuations from longer-term trends caused by network growth.
Additional techniques include tracer studies that introduce small amounts of detectable markers into specific streams, which helps trace actual pathways rather than assumed routes. Results from these tests reveal that some resources travel through indirect loops before reaching final destinations, a pattern that becomes more pronounced as the overall system expands and alternative connections become available.
Observed Patterns in Volume and Timing
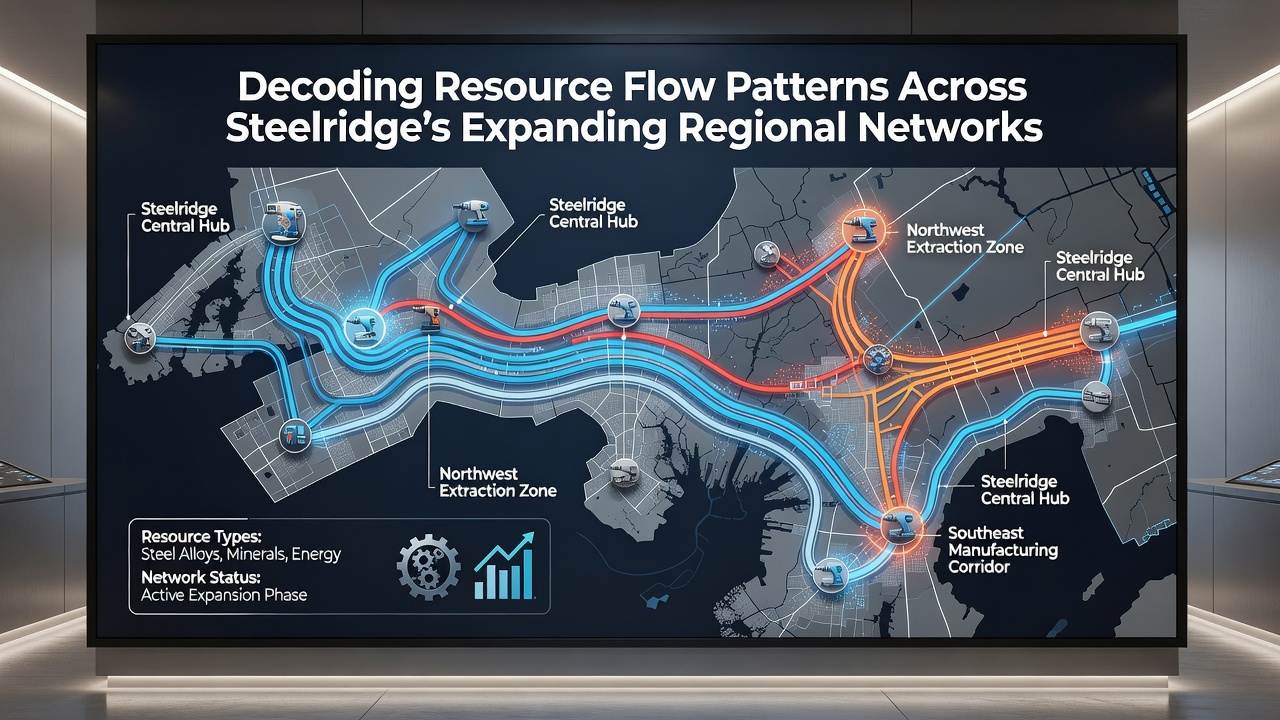
Analysis of 2025 operational logs indicates that water transfers peak between 04:00 and 08:00 local time on weekdays, while energy carrier movements show higher activity during evening hours when industrial users draw down reserves. The introduction of the new September 2026 lines is expected to shift some of these peaks because additional routing options will distribute loads more evenly. Figures released by the Canadian Centre for Infrastructure Statistics show that overall resource volume handled by Steelridge networks increased 22 percent between 2024 and 2025, with the largest gains recorded in the eastern corridor.
Researchers have also documented reciprocal flows where processed materials travel back toward extraction sites for reuse, creating closed loops that reduce net demand on primary sources. These circular patterns account for roughly 14 percent of total movement volume in the southern zone, a proportion that rises each quarter as recovery facilities expand.
Geographic Variations Across Sub-Regions
Northern segments exhibit steadier baseline flows with fewer abrupt changes, whereas central and southern sections display greater variability tied to agricultural cycles and manufacturing schedules. Data collected at the western interchange, for example, shows that resource bundles often split into smaller batches when entering densely connected areas, then recombine further downstream. This fragmentation and reassembly process becomes visible only when multiple data layers are overlaid, which explains why early mapping efforts underestimated the complexity of central zone operations.
External reports from the Australian Department of Infrastructure, Transport, Regional Development, Communications and the Arts highlight similar splitting behaviors in comparable arid-region networks, suggesting the pattern is not unique to Steelridge but appears whenever node density exceeds a certain threshold.
Integration of External Data Sources
Network operators supplement internal sensors with weather station outputs and economic indicators from regional planning agencies. When rainfall records from upstream watersheds show above-average precipitation, forward projections adjust to anticipate higher input volumes arriving within 48 hours. Likewise, employment statistics released quarterly by provincial labor offices correlate with increased outbound shipments from processing hubs, allowing planners to schedule maintenance windows that avoid conflict with rising demand.
One dataset compiled by the Steelridge University Centre for Applied Network Studies combined these variables into a predictive model that achieved 87 percent accuracy when tested against actual September 2025 flows. The same model is now being recalibrated with the new line capacities scheduled for activation in 2026.
Conclusion
Resource flow patterns across Steelridge's expanding networks reflect the combined effects of physical infrastructure growth, sensor-driven monitoring, and integration of external variables. Continued data collection through the September 2026 expansions will provide further opportunities to refine mapping techniques adn test predictive models against real-world outcomes. The resulting insights support operational decisions that maintain consistent movement across an increasingly interconnected system.